Copper Wire Price Chart: Latest Prices, Trends & Market Data
59 Views
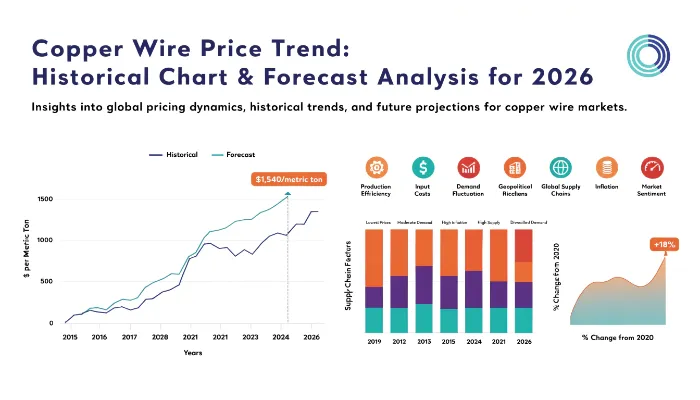
Global Copper Wire Price Trends & Updates – Q2 2026
Copper Wire Prices recorded a moderate uptrend in Q2 2026, rising by approximately 6.4% quarter-on-quarter, supported by firm copper cathode costs and resilient demand from electrical infrastructure and construction sectors. The upward movement reflected tightening raw material supply and stable industrial activity across major economies. According to the Copper Wire Price Chart, price gains were more pronounced in developed regions, while Asia saw more moderate increases due to strong domestic supply.
All pricing insights referenced in this report are derived from IMARC Group’s Q2 2026 price-tracking database, ensuring high-confidence benchmarking for procurement teams and category managers.
Regional Copper Wire Price Highlights – Q2 2026
- USA: USD 26,854/MT
- China: USD 12,535/MT
- South Korea: USD 11,162/MT
- Germany: USD 17,599/MT
- India: USD 11,037/MT
Across regions, Q2 2026 showed consistent upward momentum, though at varying intensities. North America led the increase due to strong infrastructure investments, while Asia-Pacific maintained relatively lower pricing supported by higher production capacity. Germany reflected moderate growth aligned with industrial recovery. Overall, the trend indicates a demand-driven price increase, with supply remaining stable but influenced by upstream copper costs.
Copper Wire Price Analysis – Regional Insights
North America (USA): Strong Demand Driving Premium Pricing
The USA recorded the highest price at USD 26,854/MT, reflecting robust demand from power grid expansion, renewable energy projects, and construction activity. The trend remained upward due to strong domestic consumption and elevated copper cathode costs.
Asia-Pacific (Japan, India, China): Competitive Supply Balancing Growth
- China (USD 12,535/MT): Stable production levels and export competitiveness kept pricing moderate.
- India (USD 11,037/MT): Lower pricing driven by domestic supply strength and cost-efficient manufacturing.
- South Korea (USD 11,162/MT): Maintained competitive pricing with steady demand from electronics and automotive sectors.
The region demonstrated balanced growth with controlled price increases, supported by strong supply availability.
South America (Brazil): No Direct Data Available
No verified pricing data was provided for South America in Q2 2026. However, regional trends are typically influenced by import dependency and copper supply dynamics.
Supply and Demand Overview – Q2 2026
Supply conditions for copper wire remained stable during Q2 2026, supported by consistent production of refined copper and uninterrupted manufacturing operations. However, upstream copper cathode availability tightened slightly, contributing to higher input costs.
Demand remained strong across key sectors, including power transmission, construction, automotive electrification, and renewable energy infrastructure. Increased investments in grid modernization and EV production significantly boosted consumption levels.
Overall, the quarter reflected a demand-driven growth cycle, with supply keeping pace but not sufficient to prevent price increases driven by raw material costs.
Copper Wire Price Index & Historical Analysis
The Copper Wire Price Index in Q2 2026 showed a steady upward trajectory compared to Q1 2026, reflecting rising raw material costs and strong industrial demand. Earlier in 2025, prices experienced volatility due to fluctuations in copper mining output and global economic uncertainty.
Historical trend highlights include:
- Late 2025: Price stabilization following volatility
- Q1 2026: Gradual recovery phase
- Q2 2026: Sustained upward movement
The Copper Wire price history chart indicates a strong correlation with global copper prices, particularly cathode benchmarks traded on commodity exchanges. This reinforces the importance of monitoring upstream markets for procurement planning.
Copper Wire Price Forecast 2026: What Buyers Should Expect
The Copper Wire price forecast 2026 suggests a continued upward bias with moderate volatility over the next 12 months. Prices are expected to remain supported by strong demand fundamentals and limited expansion in copper mining capacity.
Key expectations include:
- Sustained demand from renewable energy and EV sectors
- Potential supply constraints in upstream copper markets
- Stable but elevated energy and production costs
Procurement teams should consider long-term contracts and hedging strategies to mitigate exposure to price fluctuations.
Key Factors Affecting Copper Wire Prices – Quarterly Perspective
Raw Material Costs
Copper cathode prices are the primary driver of wire pricing. Any fluctuation in mining output or global copper demand directly impacts costs.
Energy Costs
Electricity and fuel costs influence manufacturing expenses, particularly in energy-intensive regions.
Industrial Demand
Strong demand from construction, power, and automotive sectors drives consumption levels.
Supply Chain and Logistics
Freight costs and supply chain efficiency affect final pricing, especially for export markets.
Technological and Infrastructure Trends
Growth in renewable energy and electrification increases long-term demand for copper wire.
What Is Copper Wire?
Copper wire is a highly conductive material widely used in electrical and electronic applications. It is manufactured by drawing copper rods into thin strands and is valued for its excellent electrical conductivity, flexibility, and durability.
Key applications include:
- Power transmission and distribution
- Building wiring and construction
- Automotive and EV systems
- Telecommunications and electronics
Its pricing is closely linked to global copper markets, making it sensitive to mining output and industrial demand trends.
Recent Developments – Q2 Highlights
- Increased infrastructure investments in the USA boosted demand.
- Stable copper mining output supported supply but did not fully offset demand growth.
- Asia maintained strong export competitiveness with lower pricing.
- Renewable energy projects globally increased copper consumption.
- Logistics conditions improved, supporting consistent supply flows.
These developments reinforced the upward pricing trend observed during the quarter.
FAQs About Copper Wire Pricing Insights & Market Analysis:
What is the Copper Wire Price Index in Q2 2026?
The Copper Wire Price Index increased in Q2 2026 compared to Q1, reflecting strong demand and rising copper cathode costs. It indicates a sustained upward trend driven by industrial and infrastructure growth.
How does the Copper Wire Price Chart help procurement teams?
The Copper Wire Price Chart provides insights into historical and current pricing trends, enabling better sourcing decisions. It helps buyers identify price cycles and plan procurement strategies effectively.
What is the Copper Wire price forecast 2026?
The Copper Wire price forecast 2026 suggests continued upward pressure with moderate volatility. Demand from electrification and renewable energy sectors is expected to support pricing levels.
How IMARC Group Helps
IMARC Group provides accurate, real-time copper wire pricing intelligence backed by robust data analysis and industry expertise. Q2 2026 insights highlight a clear upward trend driven by strong demand and raw material costs.
With forward-looking forecasts and regional insights, IMARC enables businesses to optimize procurement strategies and manage pricing risks effectively in a competitive global environment.
Stay Ahead of Market Price Changes — Explore the Latest Commodity Pricing Intelligence Reports Today: https://www.imarcgroup.com/pricing-market-reports
Contact Us:
IMARC Group
134 N 4th St., Brooklyn, NY 11249, USA
Email: sales[@]imarcgroup.com
Tel No:(D) +91 120 433 0800
United States: +1-201971-6302
Related Reading
Top 10 Hidden Secrets About Business & Finance You Need to Know
Welcome to our in-depth exploration of Business & Finance. In an era defined...
Why Business & Finance is Transforming the Global Industry Landscape
Welcome to our in-depth exploration of Business & Finance. In an era defined...