Bollinger Bands Trading Strategy Explained
By TrendyTradersSuhaib
59 Views
Bollinger Bands Trading Strategy: Complete Beginner’s Guide | Trendy Traders
Introduction
Have you ever looked at a stock chart and felt completely lost? Don’t worry — you’re not alone. Many beginners enter the stock market with excitement but struggle to understand when to buy or sell. That’s where the Bollinger Bands indicator becomes useful.
The Bollinger Bands trading strategy is one of the most popular technical analysis tools used by traders across the world. It helps traders understand market volatility, identify potential breakouts, and spot overbought or oversold conditions. Whether you trade stocks, forex, commodities, or cryptocurrencies, this indicator can simplify your decision-making process.
Think of Bollinger Bands like road boundaries on a highway. When prices move near the upper boundary, the market may be moving too fast. When prices approach the lower boundary, the market may be slowing down or becoming undervalued. These “boundaries” help traders stay on track and avoid emotional decisions.
In this guide, you’ll learn what is Bollinger Band, how the indicator works, the bollinger band formula, popular trading strategies, common mistakes, and practical tips that even beginners can apply confidently.
Learn bollinger bands indicator, bollinger bands trading strategy, what is bollinger band, bollinger band formula, and tips from best stock market mentor in india.
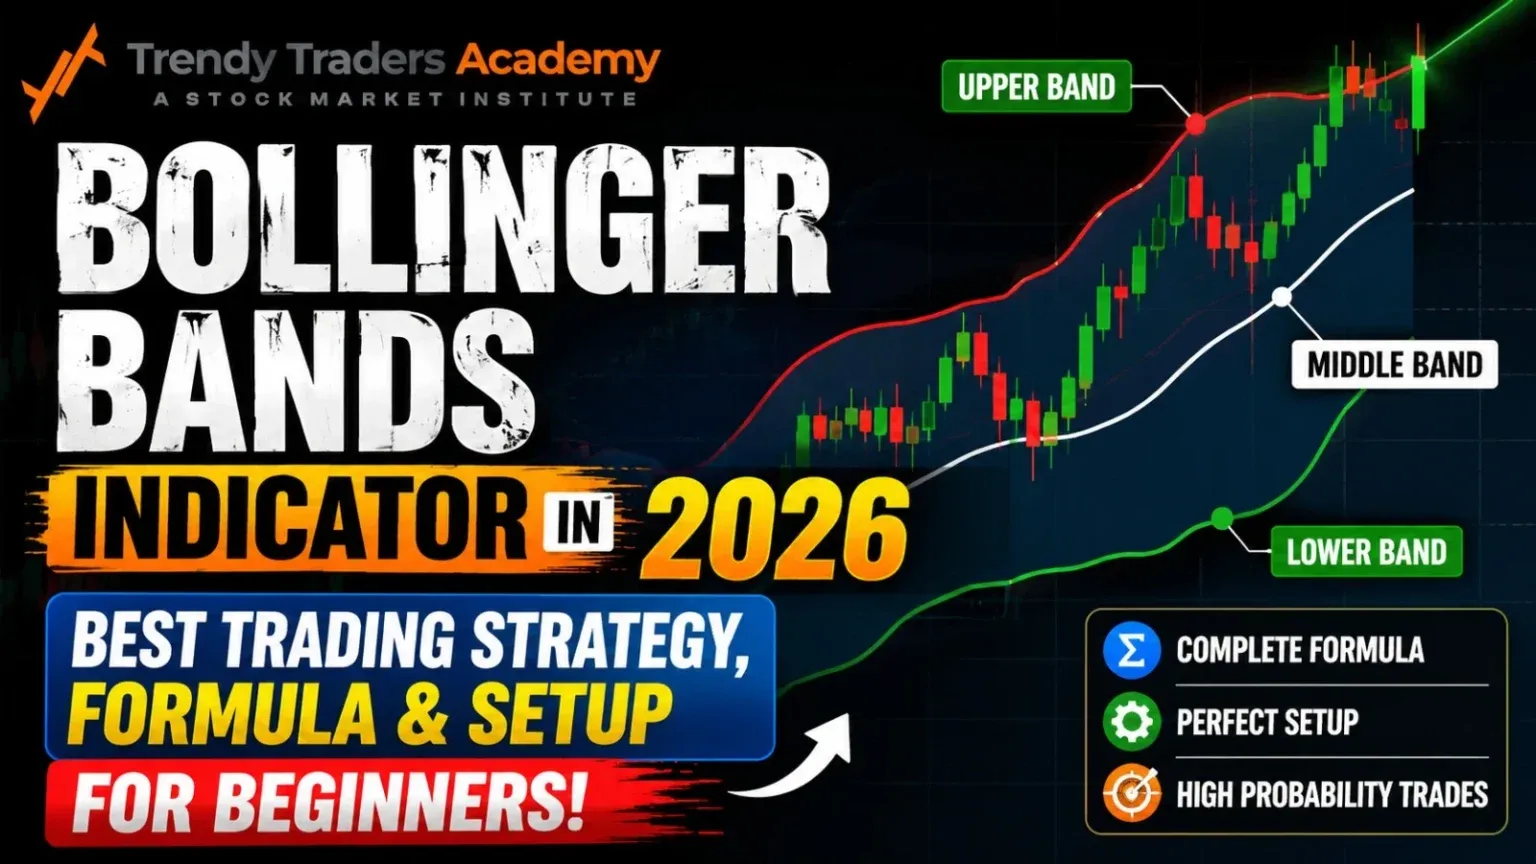
What is Bollinger Band?
The Bollinger Bands indicator is a technical analysis tool created by trader and analyst John Bollinger in the 1980s. It consists of three lines plotted on a price chart:
- Middle Band – Simple Moving Average (SMA)
- Upper Band – SMA + standard deviation
- Lower Band – SMA - standard deviation
The indicator measures market volatility. When volatility increases, the bands widen. When volatility decreases, the bands tighten.
Upper Band=SMA+2σ\text{Upper Band} = SMA + 2\sigmaUpper Band=SMA+2σ
Lower Band=SMA−2σ\text{Lower Band} = SMA - 2\sigmaLower Band=SMA−2σ
This simple structure gives traders valuable clues about possible price movements.
History of Bollinger Bands
John Bollinger developed this indicator to solve a common trading problem — understanding volatility visually. Before Bollinger Bands, traders mainly focused on moving averages without considering market volatility.
Over time, the indicator became extremely popular because it works across different markets and timeframes. Today, professional traders, investors, and even beginners use Bollinger Bands for better market analysis.
John Bollinger’s approach changed technical trading because it adapted to market conditions automatically. Instead of fixed lines, the bands expand and contract with price action.
Components of Bollinger Bands Indicator
To fully understand the bollinger bands trading strategy, you need to know its three main components.
Middle Band
The middle band is usually a 20-day Simple Moving Average (SMA). It represents the average price over a period.
SMA=P1+P2+P3+...+PnnSMA = \frac{P_1 + P_2 + P_3 + ... + P_n}{n}SMA=nP1+P2+P3+...+Pn
This line acts as a base reference for the upper and lower bands.
Upper Band
The upper band indicates higher price levels. When prices touch or move above this band, the asset may be overbought.
Lower Band
The lower band indicates lower price levels. When prices touch or fall below this band, the asset may be oversold.
Together, these bands create a visual “channel” around price movement.
Bollinger Band Formula Explained
Many beginners search for the bollinger band formula because understanding it builds confidence in using the indicator.
The standard formula is:
Bollinger Bands=SMA±(2×σ)\text{Bollinger Bands} = SMA \pm (2 \times \sigma)Bollinger Bands=SMA±(2×σ)
Where:
- SMA = Simple Moving Average
- σ = Standard Deviation
The standard deviation measures how far prices move away from the average price.
If the market becomes highly volatile:
- Bands widen
If the market becomes calm:
- Bands contract
This dynamic behavior makes Bollinger Bands highly effective.
Why Traders Use Bollinger Bands
The Bollinger Bands indicator offers several advantages.
Identifying Overbought and Oversold Conditions
When prices move near the upper band repeatedly, traders may consider the market overbought.
When prices touch the lower band, the market may be oversold.
Spotting Breakouts
Tight bands often signal a strong upcoming move.
Measuring Volatility
The indicator visually shows whether the market is calm or highly active.
Supporting Entry and Exit Decisions
Traders use Bollinger Bands to improve trade timing.
Understanding Volatility in Trading
Volatility is simply the speed and size of price movement.
Imagine boiling water in a pot. Sometimes the water is calm, and sometimes it bubbles aggressively. Markets behave similarly.
Bollinger Bands help traders “see” this volatility clearly.
- Wide Bands = High volatility
- Narrow Bands = Low volatility
Understanding volatility is crucial because it affects risk and profit potential.
Bollinger Bands Trading Strategy for Beginners
Now let’s discuss the most important part — the bollinger bands trading strategy.
Basic Buy Signal
A common beginner strategy is:
- Buy when price touches the lower band
- Sell when price moves toward the middle or upper band
Basic Sell Signal
- Sell when price touches the upper band
- Exit when price moves lower
However, traders should never rely only on Bollinger Bands. Combining them with volume or RSI increases accuracy.
Bollinger Squeeze Strategy
The Bollinger Squeeze is one of the most famous strategies.
What is a Squeeze?
A squeeze happens when the bands become very tight.
This indicates low volatility and often signals a major breakout ahead.
How Traders Use It
Bullish Breakout
- Price breaks above upper band
- Volume increases
- Traders enter buy positions
Bearish Breakout
- Price breaks below lower band
- Selling pressure increases
- Traders enter sell positions
Think of a squeeze like compressing a spring. The tighter the spring becomes, the stronger the release.
Bollinger Bounce Strategy
The Bollinger Bounce strategy works best in sideways markets.
How It Works
Prices tend to bounce between the upper and lower bands.
Buy Setup
- Price touches lower band
- Bullish candle forms
Sell Setup
- Price touches upper band
- Bearish candle forms
This strategy is simple but effective during range-bound markets.
Double Bottom and Double Top Setup
Experienced traders combine chart patterns with Bollinger Bands.
Double Bottom Pattern
A bullish reversal setup:
- First low touches lower band
- Second low stays above lower band
- Indicates weakening selling pressure
Double Top Pattern
A bearish reversal setup:
- First peak touches upper band
- Second peak fails to touch upper band
- Indicates weakening buying momentum
These setups improve trading confidence.
Combining Bollinger Bands with RSI
Using multiple indicators together increases accuracy.
What is RSI?
RSI stands for Relative Strength Index. It measures momentum.
RSI Levels
- Above 70 = Overbought
- Below 30 = Oversold
Perfect Combination
Buy Signal
- Price touches lower Bollinger Band
- RSI below 30
Sell Signal
- Price touches upper Bollinger Band
- RSI above 70
This combination filters false signals.
Common Mistakes Traders Make
Many beginners misuse the bollinger bands indicator.
Mistake 1: Blindly Buying at Lower Band
A stock can remain weak for a long time.
Mistake 2: Ignoring Trend Direction
Always check the overall trend before taking trades.
Mistake 3: Overtrading
Not every touch of the bands creates a trading opportunity.
Mistake 4: No Stop Loss
Risk management is essential.
Benefits and Limitations
Benefits of Bollinger Bands
Easy to Understand
Perfect for beginners.
Works in Multiple Markets
Stocks, forex, crypto, and commodities.
Measures Volatility
Gives visual market clarity.
Flexible
Can be combined with other indicators.
Limitations of Bollinger Bands
False Signals
No indicator is perfect.
Lagging Nature
Based on historical data.
Not Suitable Alone
Best used with confirmation tools.
Understanding both strengths and weaknesses helps traders use the indicator wisely.
Tips from Best Stock Market Mentor in India
Learning from an experienced mentor can shorten your trading journey significantly.
The best stock market mentor in india often emphasizes these principles:
Focus on Risk Management
Protecting capital matters more than quick profits.
Practice Before Real Trading
Use paper trading accounts first.
Avoid Emotional Decisions
Fear and greed destroy discipline.
Stick to a Trading Plan
Consistency creates long-term success.
Keep Learning
Markets evolve constantly.
A mentor acts like a GPS during a long road trip. Without guidance, it’s easy to take wrong turns.
How to Use Bollinger Bands in Different Markets
Stock Market
Useful for swing trading and short-term investing.
Forex Trading
Helps identify currency volatility.
Cryptocurrency Trading
Excellent for highly volatile crypto markets.
Commodity Trading
Used in gold, silver, and oil analysis.
The indicator adapts well to different trading environments.
Best Timeframes for Bollinger Bands
Different traders prefer different timeframes.
Intraday Traders
- 5-minute
- 15-minute charts
Swing Traders
- Daily charts
Long-Term Investors
- Weekly charts
Beginners usually find daily charts easier to understand because they contain less market noise.
Practical Example of Bollinger Bands Trading Strategy
Let’s understand with a simple example.
Suppose a stock trades between ₹100 and ₹120.
- Price touches lower band near ₹100
- RSI indicates oversold condition
- Bullish candle forms
A trader may buy the stock.
Later:
- Price rises toward ₹120
- Price touches upper band
- RSI becomes overbought
The trader may book profits.
This structured approach reduces emotional trading.
Can Beginners Use Bollinger Bands?
Absolutely.
The bollinger bands indicator is beginner-friendly because it visually simplifies market analysis.
However, beginners should:
- Start with demo accounts
- Use stop losses
- Avoid large trades
- Learn patiently
Trading is a skill, not a lottery ticket.
Conclusion
The Bollinger Bands trading strategy remains one of the most effective tools for identifying volatility, breakout opportunities, and market reversals. Whether you are a beginner or an experienced trader, understanding what is Bollinger Band and applying the bollinger band formula correctly can improve your market decisions.
Remember, no indicator guarantees profits. Successful trading depends on discipline, patience, risk management, and continuous learning. Bollinger Bands should be used as part of a complete trading strategy rather than a standalone signal generator.
If you practice consistently and combine technical analysis with proper education, you can gradually build confidence in the market. Many traders who learn from the best stock market mentor in india focus not only on indicators but also on mindset and risk control.
In the end, trading is like sailing a ship. Indicators like Bollinger Bands help you read the waves, but you still need skill and discipline to reach your destination safely.
FAQs
What is Bollinger Band in simple words?
Bollinger Bands are a technical indicator that measures price volatility using three lines on a chart — upper band, middle band, and lower band.
What is the best Bollinger Bands trading strategy?
The Bollinger Squeeze strategy is one of the most popular because it helps traders identify potential breakout opportunities.
What is the standard Bollinger Band formula?
The formula is:
Bands=SMA±(2×σ)\text{Bands} = SMA \pm (2 \times \sigma)Bands=SMA±(2×σ)
It uses a moving average and standard deviation.
Can beginners use the Bollinger Bands indicator?
Yes, beginners can easily learn Bollinger Bands because the indicator visually shows volatility and price movement.
Which indicator works best with Bollinger Bands?
RSI (Relative Strength Index) is commonly combined with Bollinger Bands to confirm buy and sell signals.
Related Reading
Top 10 Hidden Secrets About Business & Finance You Need to Know
Welcome to our in-depth exploration of Business & Finance. In an era defined...
Why Business & Finance is Transforming the Global Industry Landscape
Welcome to our in-depth exploration of Business & Finance. In an era defined...