Body Fat Percentage by Age: What Is a Healthy Range?
By Khoka King
25 Views
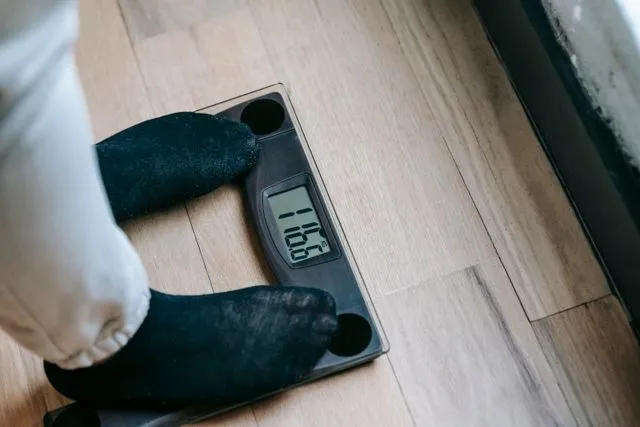
Understanding your body fat levels can help you learn more about your overall health and fitness. Body weight alone does not tell the full story because muscle, bones, water, and fat all contribute to the number on a scale. Looking at body composition can provide a broader picture of your physical health.
However, a healthy body fat level is not the same for everyone. Age, sex, genetics, activity level, and individual health conditions can all influence what is appropriate. Understanding these differences can help you set realistic fitness goals without focusing only on appearance or weight.
What Is Body Fat Percentage?
Body fat percentage is the proportion of your total body weight that comes from fat. For example, if you weigh 70 kilograms and have 21% body fat, approximately 14.7 kilograms of your body weight is fat.
Your body needs some fat to function properly. It helps store energy, protect organs, regulate temperature, and support hormone production. Essential fat is necessary for normal bodily functions, while additional fat provides energy reserves.
The goal is not to eliminate body fat. Instead, maintaining a suitable level can support general health, physical performance, and everyday activities.
How Does Body Fat Percentage Change With Age?
Body fat levels often change throughout life. During early adulthood, many people have more muscle mass and a different fat distribution than they do later in life. As people get older, muscle mass may decrease while body fat gradually increases, even if their weight stays relatively stable.
Lifestyle habits can influence these changes. Regular physical activity, strength training, balanced meals, adequate sleep, and other health factors all play a role.
When researching body fat percentage by age, remember that age alone cannot determine whether a particular percentage is healthy. Two people of the same age can have different body compositions because of their genetics, training habits, and medical history.
Older adults may benefit from paying particular attention to muscle strength and function, rather than focusing only on reducing body fat. Preserving muscle can help support mobility, balance, and independence.
What Is a Healthy Body Fat Percentage for Men?
The normal body fat percentage for men varies depending on age, activity level, and individual health needs. Men generally have a lower body fat percentage than women because of differences in hormones and the amount of fat required for normal body functions.
Physically active men may have lower body fat levels, while men who exercise less may have higher levels. Neither situation should be judged by percentage alone. Muscle mass, waist size, blood pressure, and other health indicators can also help provide context.
Some commonly used fitness references place a broad healthy range for adult men around 10% to 22%. However, this is a general reference rather than a universal medical standard. Athletes may have different targets, and extremely low body fat can affect hormonal health and energy levels.
What Is a Healthy Body Fat Percentage for Women?
The normal body fat percentage for women is generally higher than for men. This difference is natural and reflects the body's need for essential fat to support reproductive health, hormone production, and other important functions.
A commonly cited fitness reference places a broad healthy range for adult women around 20% to 32%. Individual needs can vary, particularly during pregnancy, after menopause, and with changes in activity level or health.
Women should avoid comparing their measurements directly with men's fitness targets. A percentage considered suitable for one person may not be appropriate for another. If body fat levels are very low or changes occur alongside irregular menstrual cycles, persistent fatigue, or other symptoms, seeking medical advice is sensible.
Body Fat Percentage Chart by Age
A body fat percentage chart can help readers understand general differences between age groups. However, there is no single universally accepted chart that defines the ideal body fat percentage for every adult at each age.
The following table provides a general overview of how body fat levels may change over time, rather than strict medical cutoffs.
|
Age group |
General consideration for men |
General consideration for women |
|---|---|---|
|
18 to 29 years |
Muscle development and physical activity influence body fat levels. |
Hormonal health and natural fat distribution are important. |
|
30 to 39 years |
Maintaining muscle through resistance exercise can help manage body composition. |
Changes in activity and lifestyle may affect fat distribution. |
|
40 to 49 years |
Muscle preservation and waist circumference become useful measures to monitor. |
Hormonal changes and reduced activity may influence body composition. |
|
50 to 59 years |
Strength, mobility, and overall health deserve attention alongside body fat. |
Perimenopause and menopause may affect fat distribution. |
|
60 years and older |
Preserving muscle, balance, and independence becomes increasingly important. |
Maintaining strength, adequate nutrition, and mobility remains important. |
These are general considerations, not recommended percentage ranges for each age group. Research shows that average body fat levels differ by age and sex, but population averages do not necessarily define an individual's healthiest level.
How Can You Measure Body Fat Percentage?
There are several ways to estimate body fat, and each method has advantages and limitations.
1. Body measurements: Some estimation methods use measurements such as waist, neck, and height. The U.S. Navy method also uses hip circumference for women. These measurements can provide an estimate without specialised equipment.
2. Smart scales: Bioelectrical impedance scales estimate body composition by sending a small electrical current through the body. Hydration, food intake, and recent exercise can influence the readings.
3. Skinfold measurements: A trained professional can use callipers to measure the thickness of fat beneath the skin at selected locations. Accuracy depends on the technique and the formula used.
4. DEXA scans: Dual energy X ray absorptiometry can estimate fat mass, lean mass, and bone mineral content. It is more specialised than a home measurement, and results still require appropriate interpretation.
For a convenient starting point, you can use the Body Fat Calculator to estimate your body fat percentage from relevant measurements. Treat the result as an estimate rather than a diagnosis.
How Can You Maintain Healthy Body Fat Levels?
Healthy body composition is best supported by consistent habits rather than rapid weight loss or extreme diets.
-
Exercise regularly: Combine aerobic activity, such as walking or cycling, with strength training to support cardiovascular fitness and muscle maintenance.
-
Eat balanced meals: Include vegetables, fruits, whole grains, protein sources, and healthy fats to meet your nutritional needs.
-
Get enough sleep: Consistent sleep supports recovery, appetite regulation, and general well being.
-
Avoid extreme diets: Severe calorie restriction can cause muscle loss and nutritional deficiencies.
-
Track progress sensibly: Consider energy levels, strength, waist measurements, and overall health instead of relying on one percentage.
-
Seek professional advice: A healthcare professional or registered dietitian can help interpret your measurements in the context of your medical history and goals.
Conclusion
Healthy body fat levels depend on more than age or sex. Genetics, muscle mass, lifestyle, and medical history all influence what is appropriate for an individual. General charts and online estimates can help you understand your measurements, but they should not replace personalised medical advice.
Focus on sustainable habits, adequate nutrition, regular movement, and maintaining muscle as you age. A balanced approach to health is more useful than trying to achieve a specific percentage simply because it appears on a chart.